How do you make cloud cost part of the normal workflow, instead of a monthly surprise?
Cloud costs are usually invisible until the bill shows up. By then, an oversized database, an idle instance, or a bad deploy has already cost real money for weeks. Most teams can't see which resource is actually driving their spend, so cost control happens after the fact instead of as part of the normal workflow.
Goal: trace every dollar back to the specific resource spending it.
Cost at every level
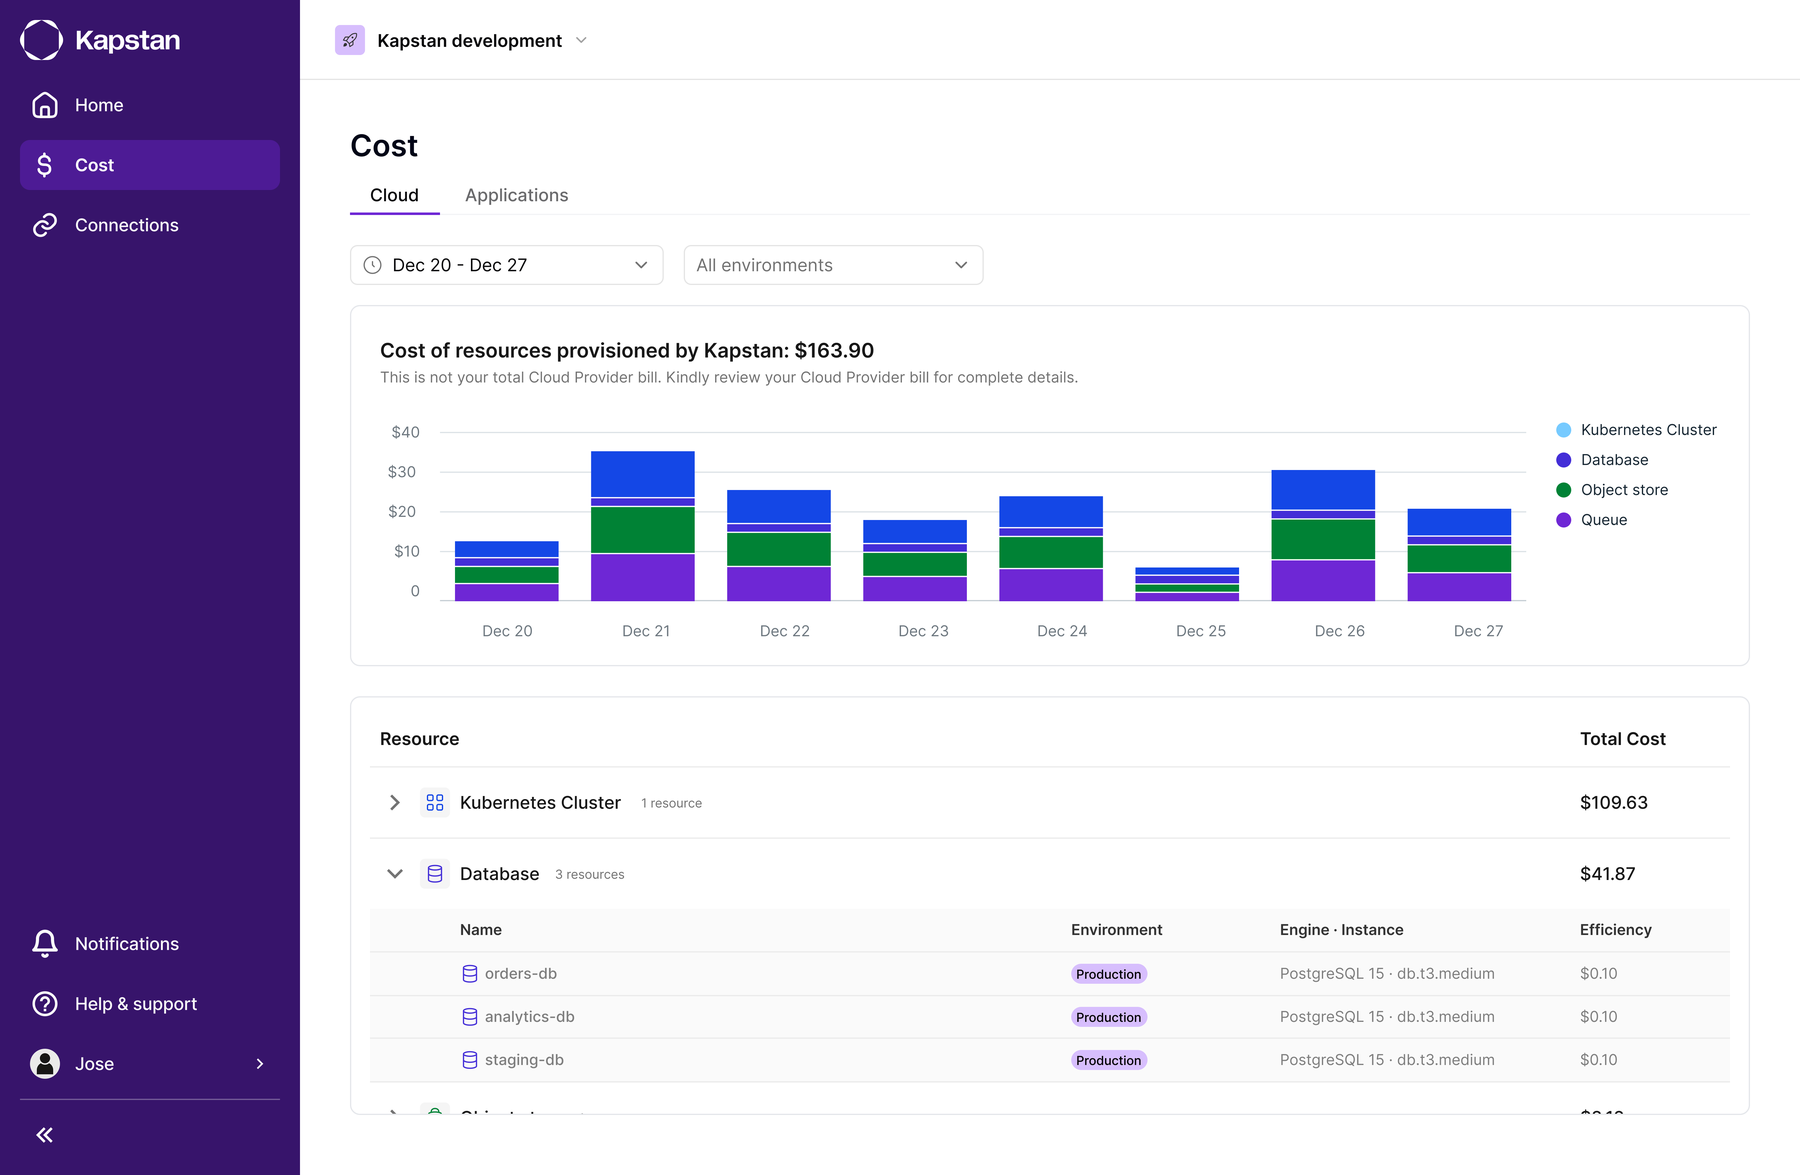
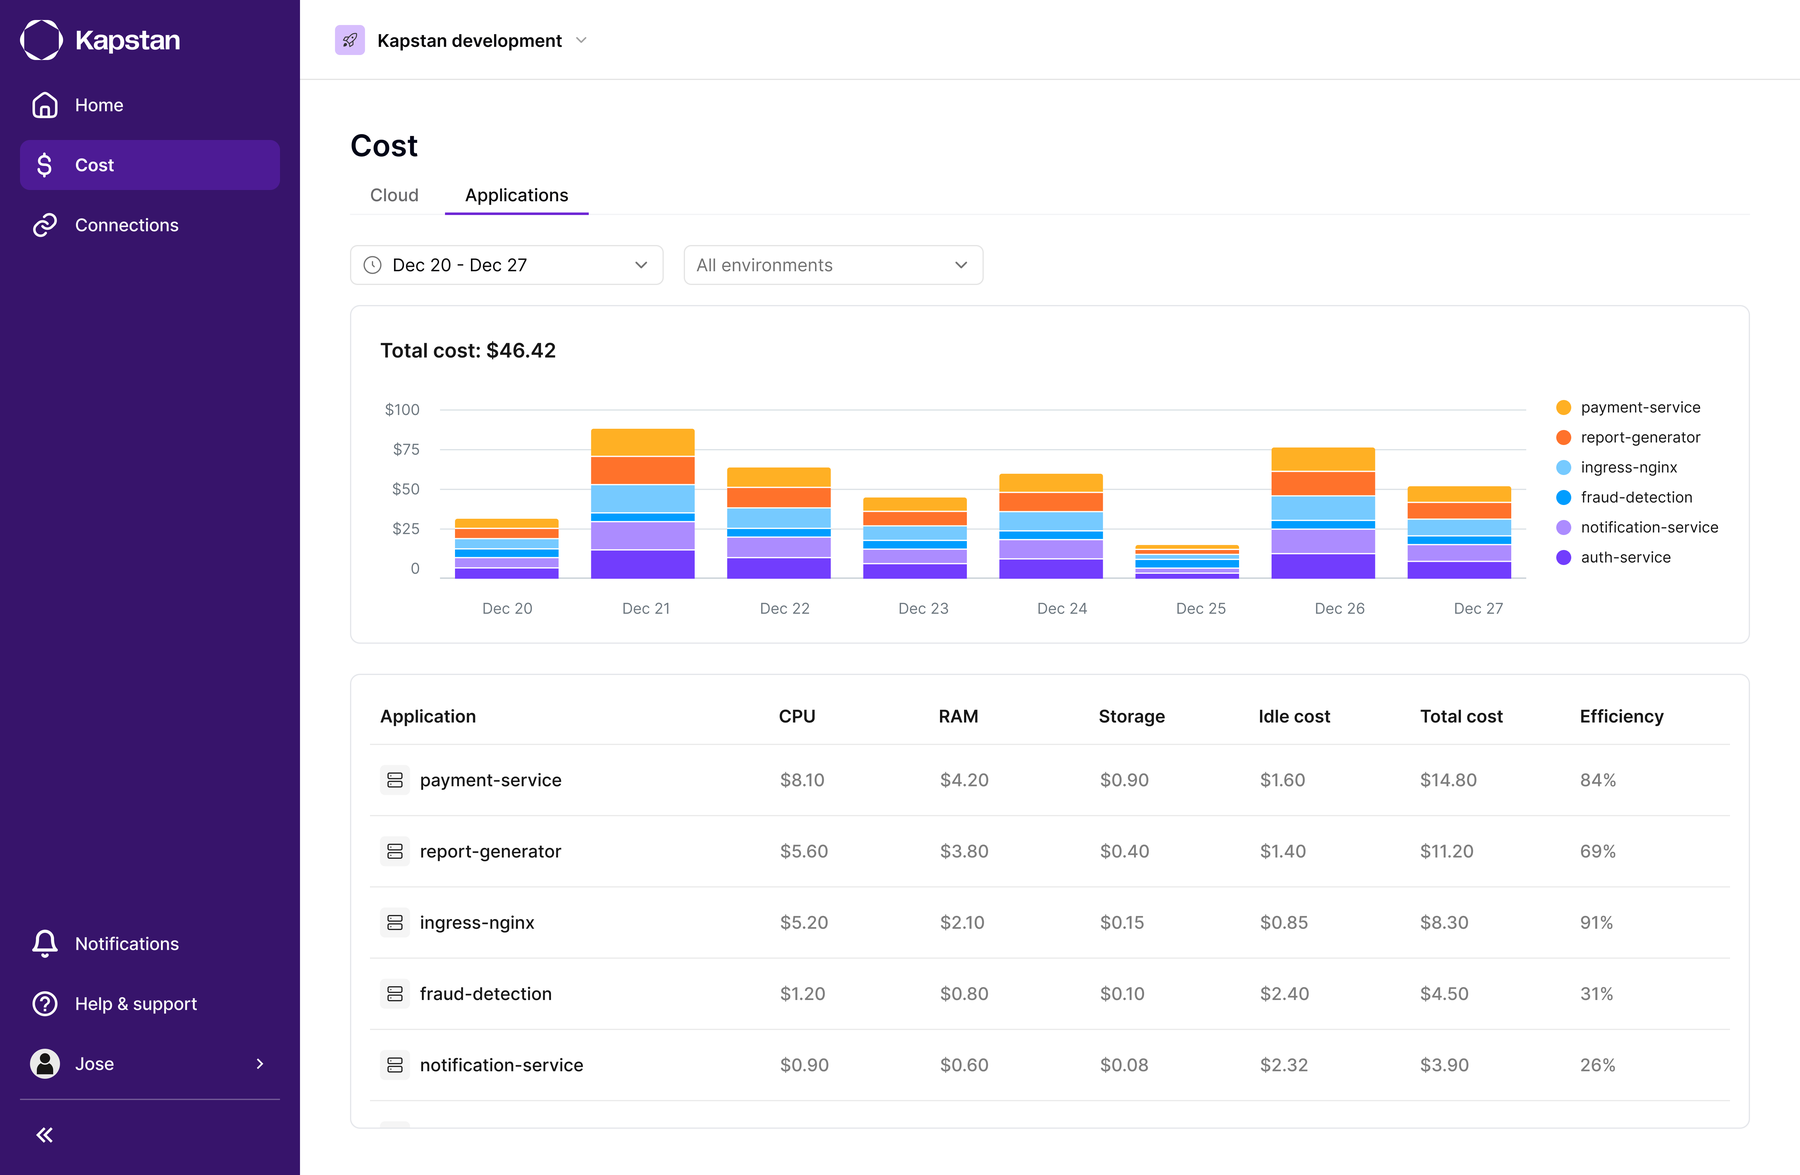
See environment, resource, and application cost from the same view.
Built into the decision
Cost guidance appears while you're setting things up, before it turns into a surprise on the bill.
Cost Explorer, at Every Level
Teams could see a total bill, but not which resource or application was actually responsible for it.
A clear line from "this is costing money" to "this is why, and where"
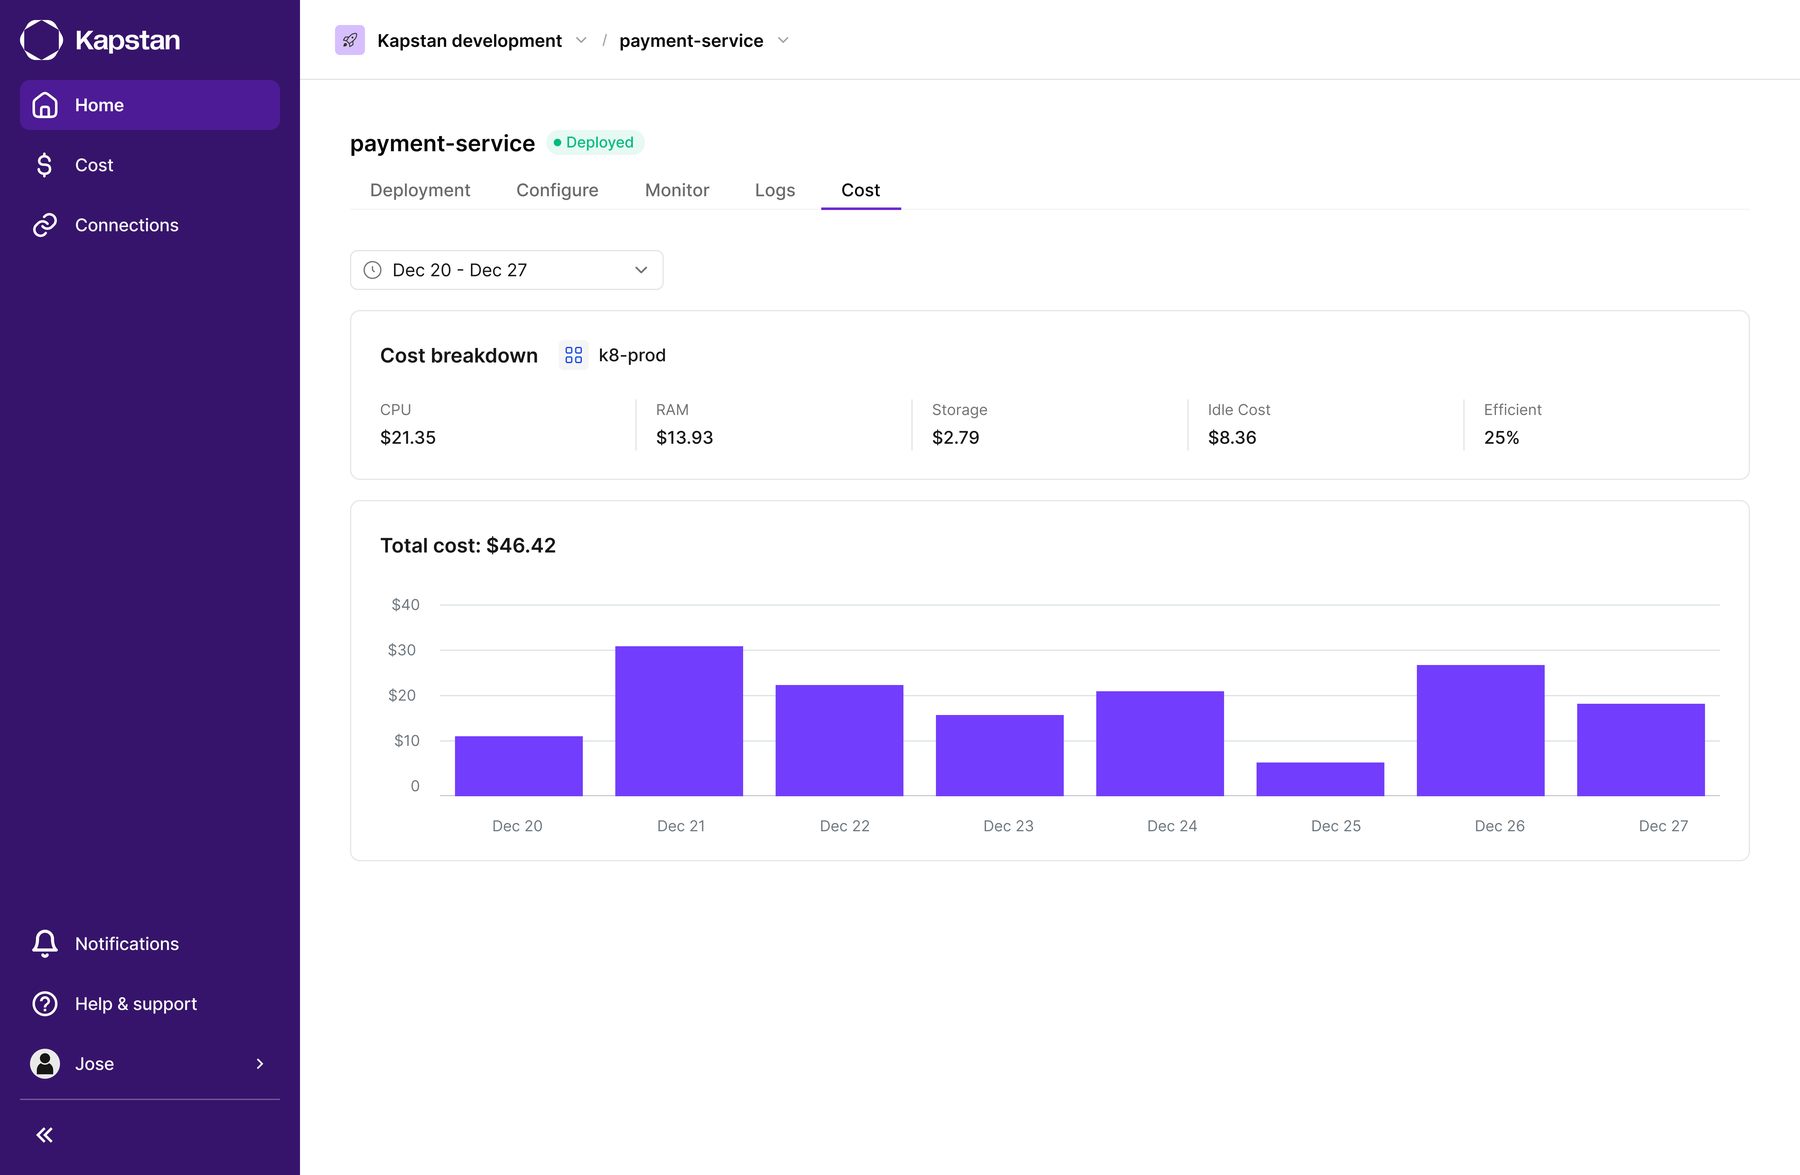
Cost breaks down by environment, resource, and application, and you can drill from one level into the next.
Cost-Optimized Recommendations
Cost decisions got made once at setup and never looked at again. That's usually the exact moment the biggest waste gets locked in.
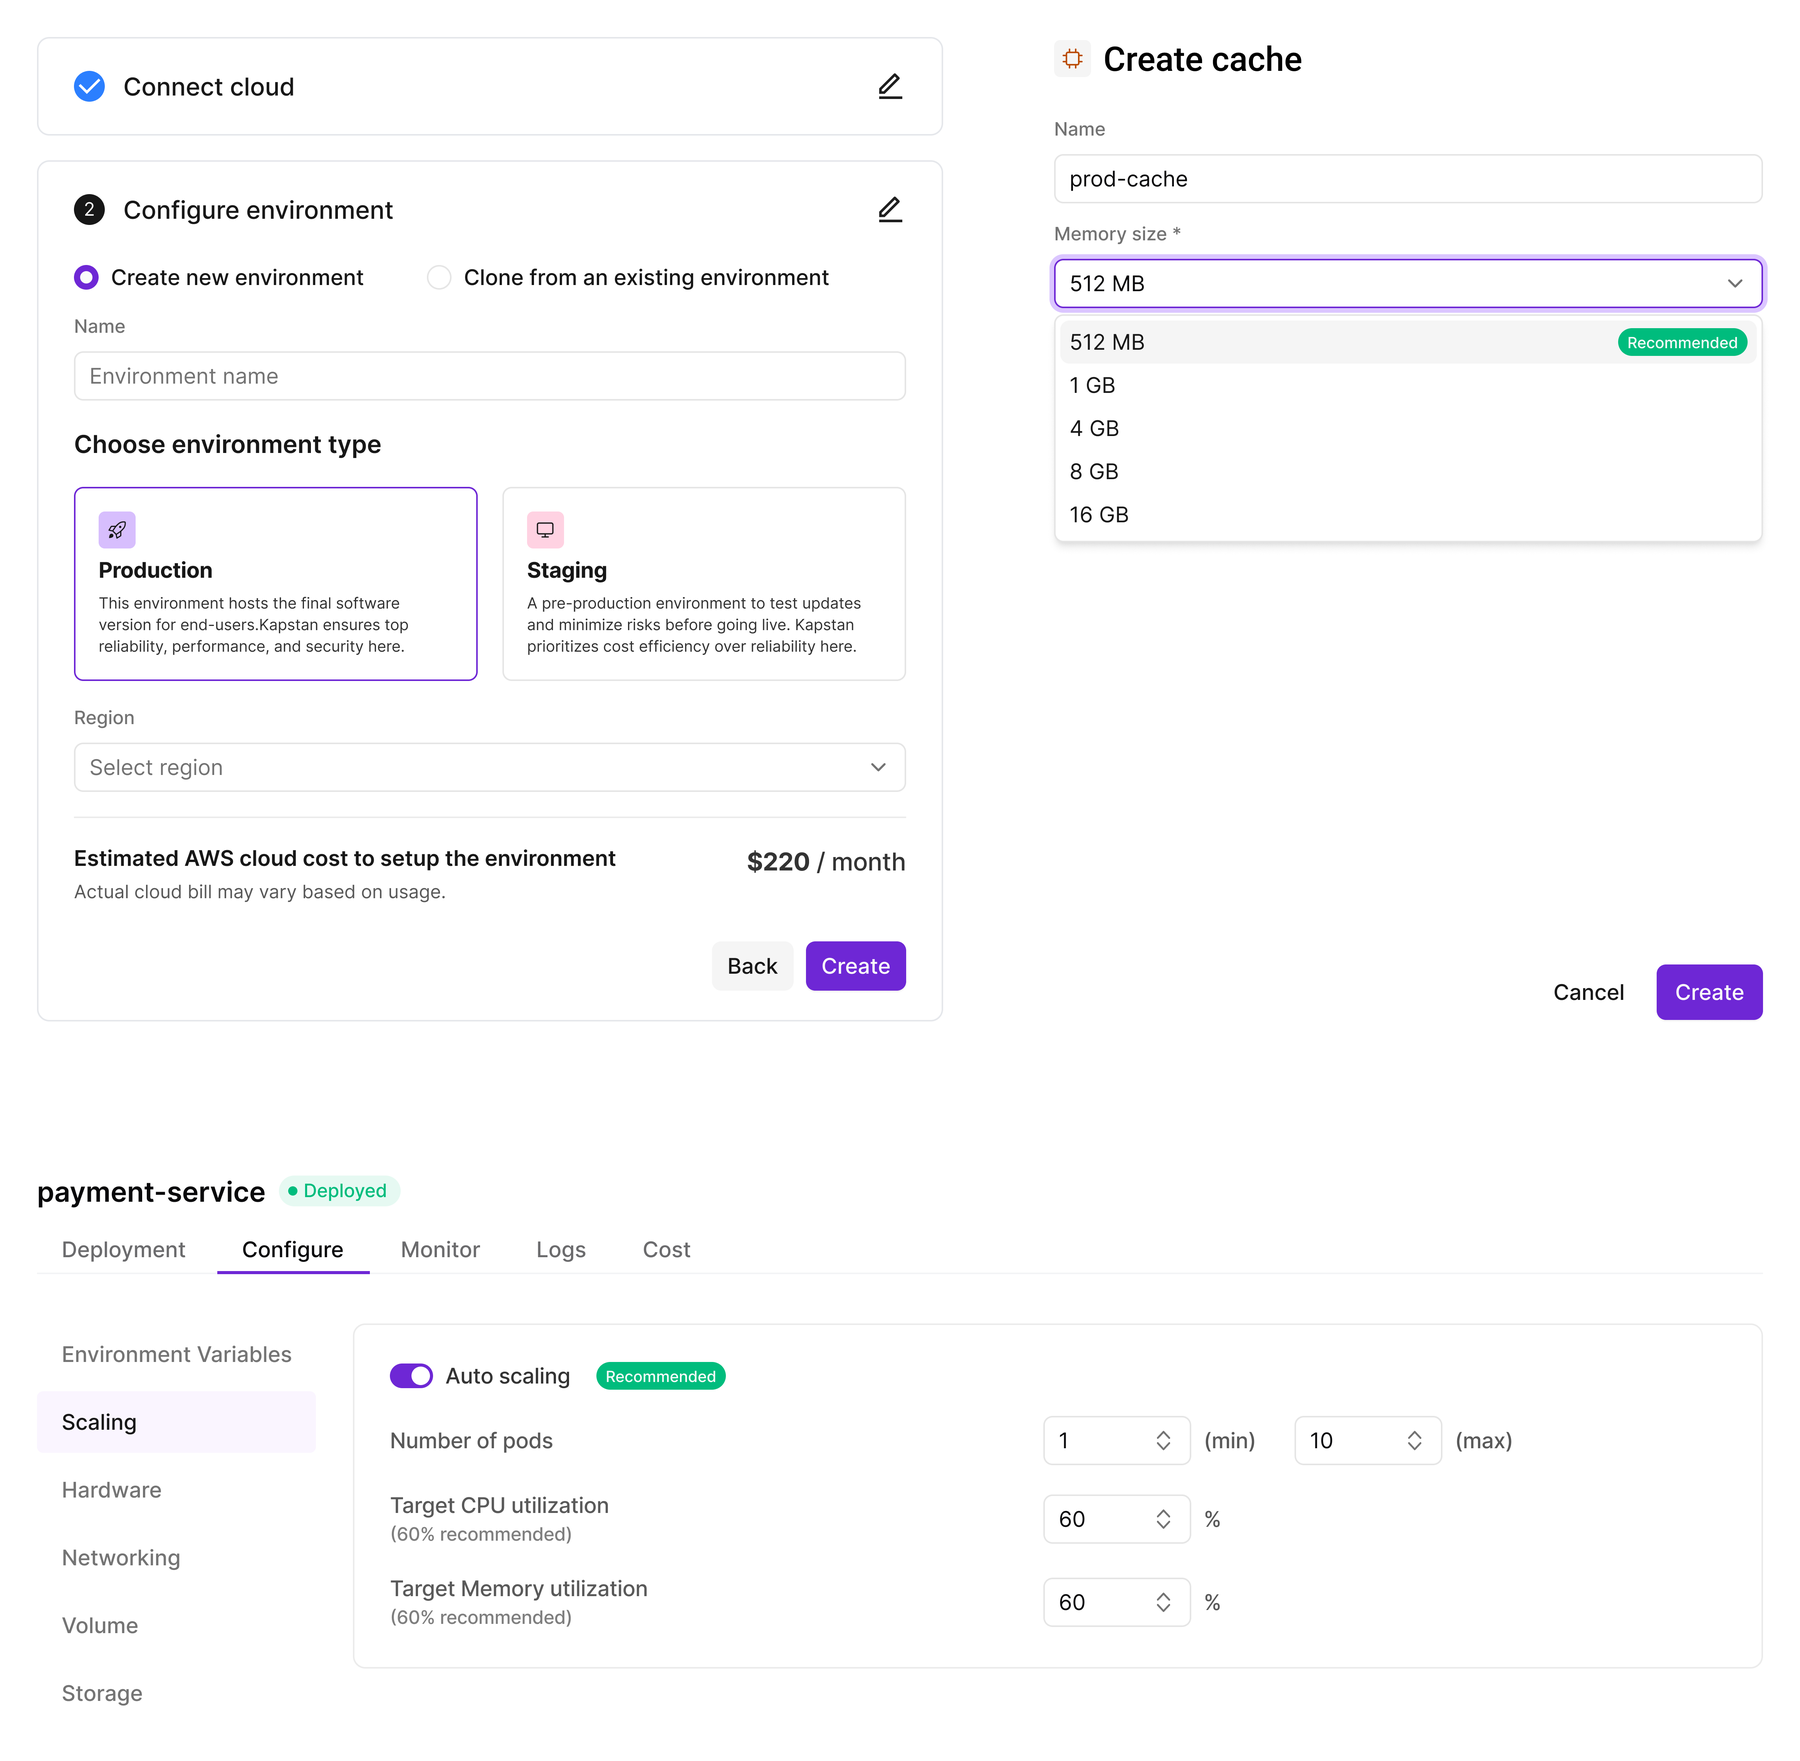
Cost guidance shows up at the moment you're deciding
Suggestions show up while you're setting up an environment. They steer staging toward cheaper configs and production toward the settings it actually needs.
Cost became something people could see every day.
Teams got an ongoing view of what was actually driving their cloud spend, instead of finding out at the end of the month. Cost management stopped being a monthly surprise and became something people could see and act on every day.
Charting the data was the easy part.
Cost dashboards are easy to build and hard to make people trust. Charting the data was never the hard part. Making sure every number could be traced back to a real, specific resource was, since that's what let someone actually act on it instead of just looking at it.